
America meets the
self-driving car
Self-driving cars are no longer a distant idea. Most U.S. adults have heard of them, a growing share have seen one, and roughly one in fourteen have taken a ride. This brief traces how Americans are moving from awareness to real-world interaction — and what they think about the technology.
School of Sustainable Engineering and the Built Environment, Arizona State University
From awareness to experience: where every American stands today
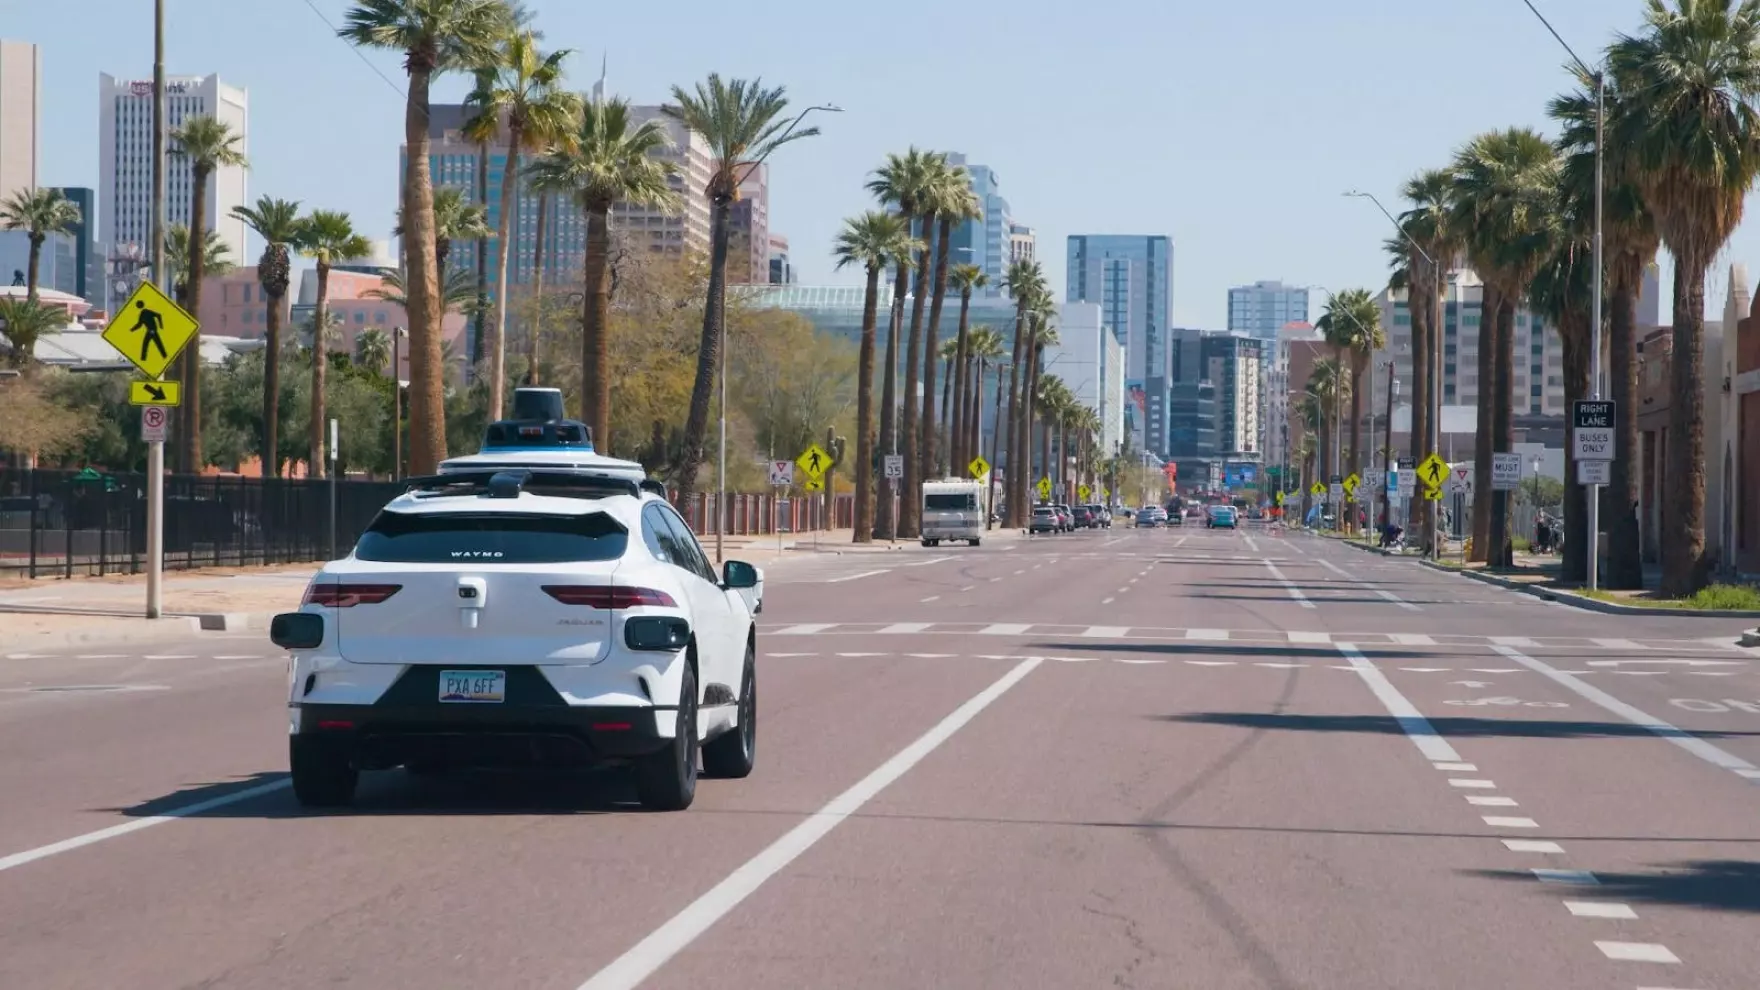
Autonomous vehicles (AVs) are operating on public roads in Phoenix, San Francisco, Austin, and a growing number of cities. Self-driving ridehailing services are already available to the public in these markets. The Transportation Heartbeat of America (THA) Survey, conducted with 8,567 U.S. adults nationwide in February and March 2026 by the TBD National Center, captures where the broader American public stands in relation to that reality.
The headline finding: roughly 7% of U.S. adults — approximately one in fourteen — has ridden in an AV, a meaningful early-adopter base given that commercial operations remain concentrated in a handful of cities. Eight in ten Americans (81%) are aware that AVs are being offered as a ridehailing service, reflecting how widely the technology has registered in public consciousness. The chart below shows where the full population stands today.
of U.S. adults have ridden in a self-driving car — a technology whose commercial operations currently span just a handful of cities.
Who rides — and where?
Riding rates are highest among adults aged 25–44, those with a Master’s degree or higher, and residents of the West — where commercial AV ridehailing services are currently concentrated. Men report higher riding rates than women (10.2% vs. 4.1% of all adults in each group), a gap that likely reflects broader differences in ridehailing use. Across income groups, higher-income respondents are considerably more likely to have ridden — consistent with current AV service pricing and deployment in higher-income urban markets. Use the controls below to explore how riding rates vary across the population.
Most Americans have a clear sense of how comfortable they would feel in and around AVs
The survey asked Americans to rate their comfort across four situations involving AVs. Comfort levels are broadly similar across three of the four scenarios — riding alone, walking or biking nearby, and driving alongside one — with roughly one in four Americans feeling comfortable in each. Comfort is lowest when it comes to sharing a ride with strangers, where only about one in six feel at ease. The results suggest that the social dimension of shared AV rides is a distinct concern, separate from comfort with the technology itself.
“Roughly one in four Americans feels comfortable riding alone in a self-driving car. That figure drops to one in six when sharing the ride with strangers.”
Who feels most comfortable
Among demographic groups, comfort levels rise sharply with education: respondents with a graduate degree are roughly three times as likely to feel comfortable across all four situations as those with a high school education or less. Younger adults, men, and higher-income respondents also report greater comfort. But nothing matters more than firsthand experience. For example, nearly 72% of respondents who have previously ridden in an AV say they would feel comfortable riding alone, compared with just 21% of those who have not. Similar gaps appear across all four situations. Use the controls in the figure below to explore how comfort varies by demographic group and prior AV experience.
Americans hold clear views on self-driving cars — views shaped as much by expectation as by experience
Looking beyond personal comfort levels, the survey also explored how Americans think about control, trust, and public accountability in an AI-driven transportation system. Three in four Americans believe communities should have a say in how AI is used in transportation, and an equal share want the ability to manually take control of an AV if something goes wrong. Just over half are skeptical that AVs will be widely available in the near future. Roughly one in five say they would be more willing to cross the street in front of a self-driving car than a human-driven one, support public investment in AV infrastructure, or trust that AI-powered transportation is more reliable. Taken together, the public is engaged with the implications of the technology — supportive of oversight and personal control, and measured in its expectations about adoption pace.
Across all six items, prior AV experience shapes attitudes more strongly than any other demographic factor — but its influence is selective. Attitudes toward oversight and personal control are nearly universal regardless of experience: those who have never ridden in an AV are just as likely to want manual control or community oversight as those who have. Where experience makes a striking difference is on trust and investment: those who have ridden in an AV before are roughly three times more likely to support public investment in AV infrastructure, trust that AI-powered transportation is more reliable, and say they would cross in front of a self-driving car. Education and income show consistent but more modest gradients across all items. Use the controls below to explore how views vary by demographic group and prior AV experience.
Subscribe to the TBD Newsletter for new research findings, data briefs, dashboard updates, and insights from across the TBD Center’s research portfolio.
Sample: The respondent sample includes 8,567 U.S. adults (aged 18 and older) nationwide who answered the survey between February and March 2026. The sample was designed to be representative of the U.S. adult population across gender, age, education, census region, household vehicle ownership, and household income.
Respondents were recruited through an online panel with quotas specified across gender, age, education, household income, household location, and census division to ensure demographic and geographic representativeness. Multiple attention checks and quality control measures were applied throughout.
Weighting: All figures are from a weighted analysis. Survey responses were weighted to correct for nonresponse and to align with national demographic targets based on Current Population Survey benchmarks for the U.S. adult population.
Sample composition: The table below shows the unweighted and weighted distributions of key demographic characteristics in the survey sample.
| Attribute | Unweighted (%) | Weighted (%) |
|---|---|---|
| Gender | ||
| Men | 47.1% | 49.0% |
| Women | 52.9% | 51.0% |
| Age | ||
| 18–24 years | 11.4% | 11.7% |
| 25–44 years | 31.6% | 34.5% |
| 45–64 years | 29.7% | 30.9% |
| 65+ years | 27.4% | 22.9% |
| Education | ||
| High school or less | 32.2% | 37.3% |
| Some college or associate | 32.5% | 28.5% |
| Bachelor’s degree | 17.3% | 16.4% |
| Master’s or higher | 18.1% | 17.8% |
| Household Income | ||
| Under $50,000 | 39.2% | 30.5% |
| $50,000–$99,999 | 26.5% | 28.2% |
| $100,000–$149,999 | 19.7% | 17.8% |
| $150,000 or more | 14.6% | 23.6% |
| Census Region | ||
| Northeast | 20.5% | 17.3% |
| Midwest | 20.6% | 20.4% |
| South | 37.4% | 38.7% |
| West | 21.5% | 23.6% |
Research team: Dale Robbennolt, Anna Beliveau, Chandra R. Bhat (The University of Texas at Austin); Irfan Batur, Ram M. Pendyala, Steven E. Polzin (Arizona State University); Patricia L. Mokhtarian (Georgia Institute of Technology); Atiyya F. Shaw (University of Michigan); Cynthia Chen (University of Washington); Alison J. Conway (The City College of New York).